
Quick Answer
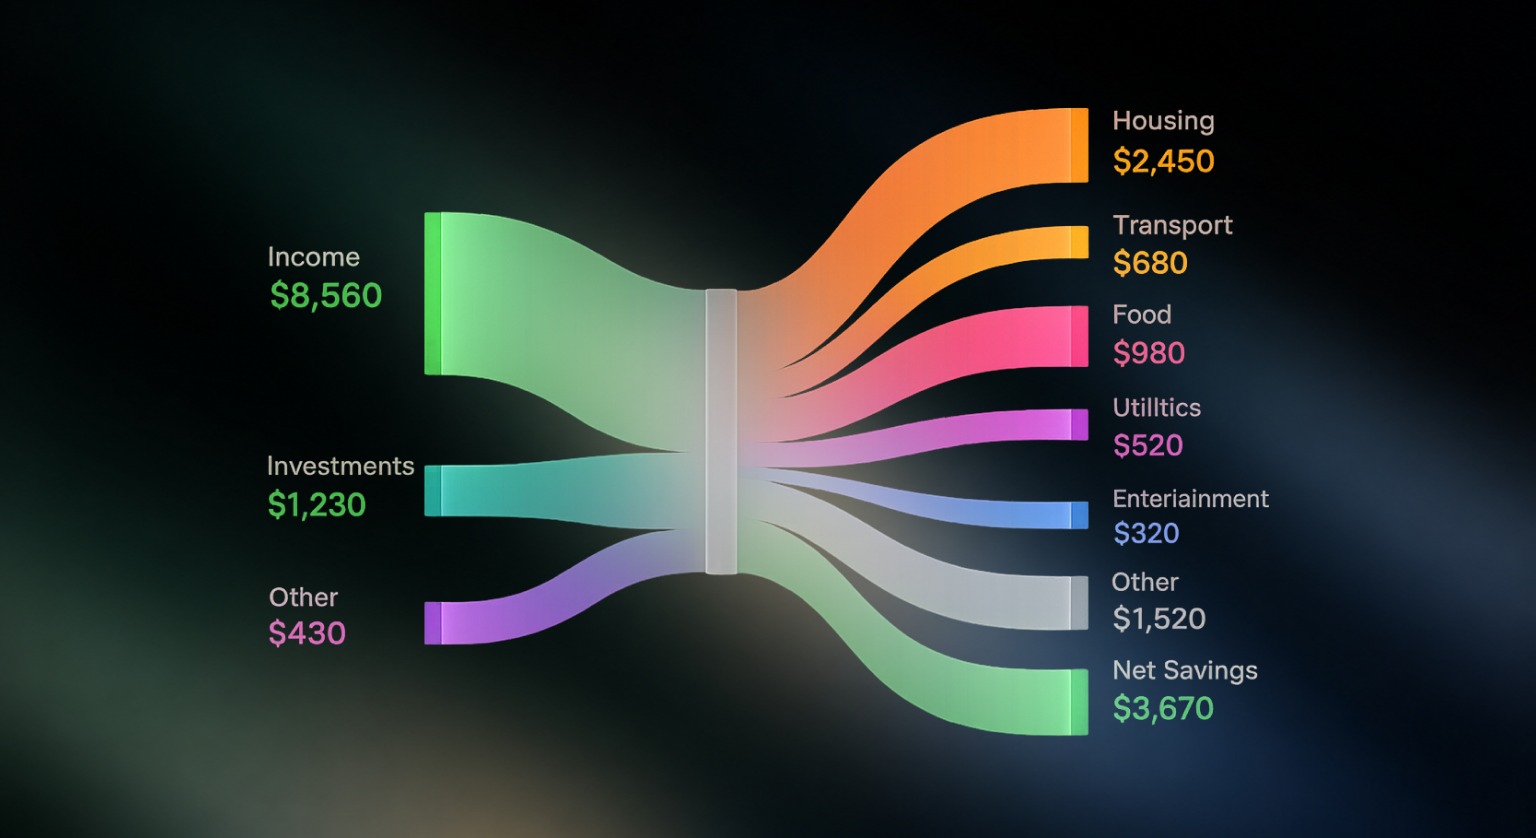
A cash flow chart is a visual record of money coming in (income) and money going out (expenses) over a period of time. The difference between the two is your net cash flow. A positive number means you kept more than you spent. A negative number means you spent more than came in. An AI finance app connected to your accounts can build this picture automatically from available transaction data, without requiring manual entry.
Most people have a rough sense of whether they are doing okay financially, based mostly on whether money is in the account when they need it. That is a reasonable short term signal. It is a poor substitute for actually knowing where the money is going and whether the direction is sustainable.
A cash flow chart makes that direction visible. It takes income and expenses across a period of time, usually a month or a year, and turns them into a picture you can actually look at. A month where income exceeded expenses by a healthy margin looks very different from a month where a subscription renewal, a car repair, and an unexpected medical bill all landed in the same week. The chart captures both.
Understanding cash flow is also the starting point for almost every other financial decision. Whether you can afford to save more, whether you could handle a higher rent payment, whether your debt payments are sustainable, all of those questions depend on knowing the gap between what comes in and what goes out.
Cash Flow Is the Engine of Personal Finance
Personal finance is a broad term that covers everything from how you spend day to day to how you save for decades ahead. Budgeting, net worth tracking, debt management, retirement planning, emergency funds, all of those things matter. But they all run on the same engine: cash flow.
Here is why. Your net worth grows because you have money left over each month to put toward savings or paying down debt. Your emergency fund builds because consistent positive cash flow lets you set something aside. Your debt shrinks when more comes in than goes out. Your retirement account compounds because you fund it regularly from a surplus. Every major personal finance goal, without exception, depends on whether your cash flow is positive and whether that surplus is being directed somewhere useful.
This is also why financial stress so often circles back to cash flow. According to the Consumer Financial Protection Bureau, difficulty covering monthly expenses is one of the most common indicators of financial vulnerability among American adults. It is not usually that people do not want to save or pay down debt. It is that the margin between income and expenses is too thin, or inconsistent, to do it reliably. Seeing that margin clearly is the first step toward managing it.
Cash flow is not one piece of personal finance. It is the foundation everything else is built on. You cannot build savings, reduce debt, or grow net worth without first understanding what is coming in and going out.
What a Cash Flow Chart Actually Shows
A cash flow chart has three core components. Income is everything that comes in: salary, freelance work, investment income, rental income, anything that adds to what is available. Expenses are everything that goes out: rent, groceries, subscriptions, debt payments, everything spent. Net cash flow is the difference, income minus expenses, which is either positive or negative each month.
Shown across twelve months, these three lines or bars tell a richer story than any single monthly budget. You can see which months tend to be tight because insurance premiums and holiday spending both land in the same quarter. You can see whether your savings are growing consistently or whether the saving months alternate with deficit months. You can see whether a rising income has translated into a rising net cash flow or whether expenses expanded to absorb the difference.
A single month of cash flow is a snapshot. A year of cash flow is a pattern. Patterns are where the useful information actually lives.
How to Read a Cash Flow Chart
| What you see | What it means |
| Income bars consistently above expense bars | You are living within your means. The gap between them is what becomes savings or investment if directed intentionally. |
| Expense bars regularly exceeding income bars | Spending is outpacing earnings on a sustained basis. This adds to debt or draws down savings over time. |
| Large expense spikes in specific months | Seasonal or irregular costs like insurance premiums, travel, or holiday spending. These are predictable and can be planned for. |
| Net cash flow trend moving upward over time | Your financial position is strengthening. Either income is rising, expenses are falling, or both. |
| Net cash flow flat despite rising income | Lifestyle expansion is absorbing income growth. Spending is rising at roughly the same rate as earnings. |
| Wide monthly variation in net cash flow | Irregular income, irregular expenses, or both. Averaging over three to six months gives a clearer picture than any single month. |
The Problem With Building One Manually
Building a cash flow chart by hand means pulling transaction data from every bank account, every credit card, and every other payment method, sorting each transaction into an income or expense category, totalling them by month, and then charting the result. For someone with two accounts and a simple financial life, that is a manageable Sunday afternoon task. For someone with five or six accounts, a few credit cards, and a mix of regular and irregular income, it quickly becomes an exercise that happens once and then gets abandoned.
The other problem is staleness. A manually built cash flow chart is accurate as of the day it was built and progressively less accurate every day after that. Most people who build one find themselves relying on it for decisions based on data that is weeks or months out of date.
How an AI Finance App Changes This
This is one of the most direct practical applications of connecting your accounts to an AI finance tool. Rather than assembling your cash flow picture by hand, the app retrieves available transaction data from supported connected accounts, categorises the transactions, and builds the income versus expense picture automatically. The chart updates as new data arrives from your connected sources.
Automatic categorisation from available data
An AI tool connected to your bank and credit card accounts through read only access can categorise incoming and outgoing transactions from the available data without manual input. Grocery charges go under food, direct deposits under income, streaming subscriptions under subscriptions. The categorisation is not perfect, and corrections are worth making when something is misread, but the process removes much of the manual sorting that makes cash flow tracking impractical to sustain by hand.
Plain language observations, not just charts
Rather than leaving you to interpret a bar chart yourself, a well built AI finance app surfaces informational observations based on available data from your connected accounts. An observation that your expenses exceeded income in two of the past three months, or that your food delivery spending has grown significantly quarter on quarter, gives you something to respond to rather than a chart to stare at. All such observations are informational only and are not financial advice.
Questions answered directly
Instead of scrolling through twelve months of charts to find your answer, you can ask directly. How much did my total expenses exceed my income last quarter? What was my average monthly net cash flow over the past six months? The AI surfaces the answer from available connected account data rather than requiring you to navigate to the right view and calculate it yourself. Responses reflect the latest available data from supported connections.
Irregular income and variable expenses handled automatically
For anyone with freelance income, variable hours, or expenses that shift significantly from month to month, a manually updated cash flow chart is particularly hard to keep current. An AI tool that retrieves available transaction data from connected accounts handles the irregular nature of real income and real spending without requiring you to account for every variation by hand.
Where Cash Flow Fits in Your Broader Personal Finance Picture
A cash flow chart is a descriptive tool. It tells you what happened with your money over a period of time. It does not tell you whether your current pattern is sustainable long term, how much risk you are carrying, or whether your savings rate is appropriate for your goals and circumstances. Those questions need other tools alongside it.
Cash flow and net worth
Your net worth, everything you own minus everything you owe, moves in response to your cash flow. Sustained positive cash flow that is directed toward savings and paying down debt grows net worth over time. Sustained negative cash flow erodes it. A cash flow chart and a net worth tracker used together give you both the engine reading and the destination: one tells you how the month went, the other tells you whether the direction is right.
Cash flow and debt
Debt repayment comes directly out of cash flow. Someone paying 400 dollars a month on a car loan and 300 dollars on a credit card is directing 700 dollars of their monthly cash flow toward liabilities before any discretionary choice is made. Seeing this in a cash flow chart makes the cost of carried debt visible in a way that a debt balance alone does not. A high debt balance feels abstract. Watching 700 dollars leave every month makes it concrete.
Cash flow and savings
The same logic applies to savings. A cash flow chart that shows a consistent surplus each month tells you the savings capacity exists. Whether that surplus is actually being directed toward an emergency fund, a retirement account, or a savings goal is a separate question, but the cash flow view tells you what is available to work with.
Cash flow and financial planning
Any meaningful personal finance goal, whether it is buying a home, paying off student loans, building an emergency fund, or retiring comfortably, has a cash flow requirement behind it. A home deposit requires years of positive cash flow directed toward savings. Student loan payoff requires allocating a portion of monthly surplus toward the balance. A cash flow chart does not make those decisions, but it tells you honestly whether the capacity to pursue them exists in your current financial picture.
Pairing a cash flow view with a net worth tracker gives the most complete picture of where you actually stand. Cash flow without net worth tells you how the month went but not where you are headed overall. Net worth without cash flow tells you your position but not the momentum driving it.
WealthNX and Cash Flow Visibility
WealthNX can connect to supported bank and credit card accounts through read only connections and retrieves available transaction data from supported connected accounts to surface informational observations about income and expense patterns over time. The AI assistant can answer direct questions about your cash flow based on available data from your connected accounts, in plain language, without requiring you to navigate multiple screens or build a chart yourself.
WealthNX holds ISO 27001 certification, the internationally recognized standard for information security management, and does not sell your financial data to third parties. WealthNX is the publisher of this article and references its own services where relevant.
A cash flow chart built from available connected account data and updated automatically removes the single biggest reason most people never maintain one: the time and effort of keeping it current by hand.
The Honest Takeaway
Cash flow is where personal finance actually lives, day to day and month to month. Every savings goal, every debt payoff plan, every step toward financial stability depends on the gap between what comes in and what goes out. A cash flow chart makes that gap visible, and visible is where manageable starts.
An AI finance app connected to your accounts changes how easy it is to maintain that visibility. The chart updates as new data becomes available from connected sources. The observations surface without requiring you to know what to look for. The questions you have get answered from available data rather than from manual calculation.
The downloadable template included with this article gives you a starting point if you want to build one in a spreadsheet. Replace the yellow cells with your own numbers and the chart updates automatically. Or connect your accounts to an AI finance tool and let the process happen without the spreadsheet altogether. Either way, the goal is the same: seeing your own cash flow clearly enough that you can do something useful with it.
Frequently Asked Questions
What is a cash flow chart?
A cash flow chart is a visual record of income coming in and expenses going out over a set period, usually month by month across a year. The difference between the two is net cash flow. It is used to understand whether spending is sustainable, to spot seasonal patterns, and to see whether a financial position is strengthening or weakening over time.
How is a cash flow chart different from a budget?
A budget is a plan for how money should be spent. A cash flow chart is a record of how money was actually spent. Both are useful, but they serve different purposes. A budget sets expectations. A cash flow chart tells you whether reality matched them.
How can an AI finance app help with cash flow tracking?
An AI finance app connected to your accounts can retrieve available transaction data from supported connected accounts, categorise income and expenses automatically, and surface informational observations about your cash flow pattern without requiring manual data entry. It also allows you to ask direct questions about your cash flow and receive answers based on available data from your connected accounts.
What is the difference between positive and negative cash flow?
Positive cash flow means more money came in than went out during the period. Negative cash flow means more went out than came in. A single month of negative cash flow can be normal, particularly for months with large irregular expenses. A sustained pattern of negative cash flow, over several months, indicates that spending is outpacing income on an ongoing basis.
Disclaimer
This article is for general informational and educational purposes only and does not constitute financial advice. The downloadable cash flow template uses sample figures for illustration purposes. WealthNX is the publisher of this article and references its own services where relevant. WealthNX holds ISO 27001 certification, the internationally recognized standard for information security management.
All AI generated observations from finance apps are informational only and are not personalised financial advice. Responses are generated from available data from connected accounts and may be affected by incomplete, delayed, or unavailable data from connected accounts. For advice tailored to your situation, consult a licensed financial advisor.