
Stock Market Sector Performance for 11 US Sectors, Day by Day
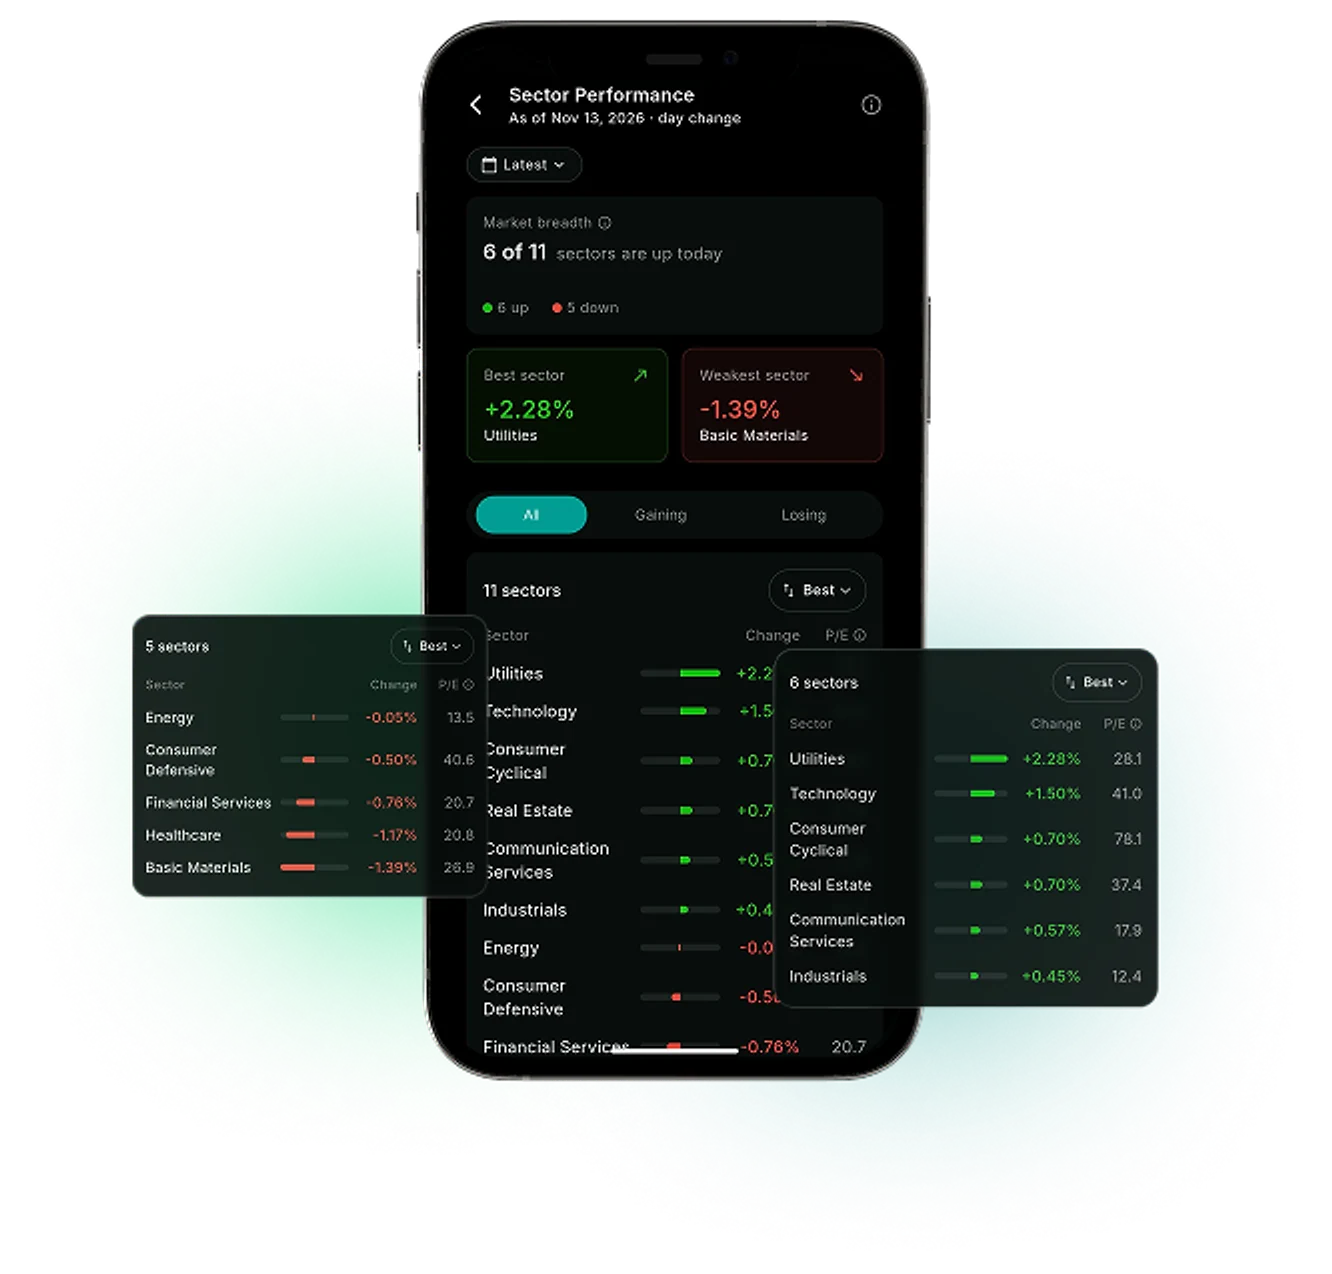
Each sector's average price change and P/E for the latest trading day or an earlier one, with market breadth and the sectors that moved most. Data from FMP.
Market data sources




A Market Headline Names One Sector and Leaves Out the Other Ten
WealthNX shows stock market sector performance for 11 US sectors on one screen. Each sector's change is the average price change of its US-listed companies on that trading day, next to its average P/E. Market breadth counts how many sectors rose, and earlier trading days are there to review.
What Sector Performance Shows
Market breadth at a glance
How many of the 11 sectors rose and how many fell on the selected day.
The largest gain and the largest drop
The sector that rose most and the sector that fell most, in two tiles.
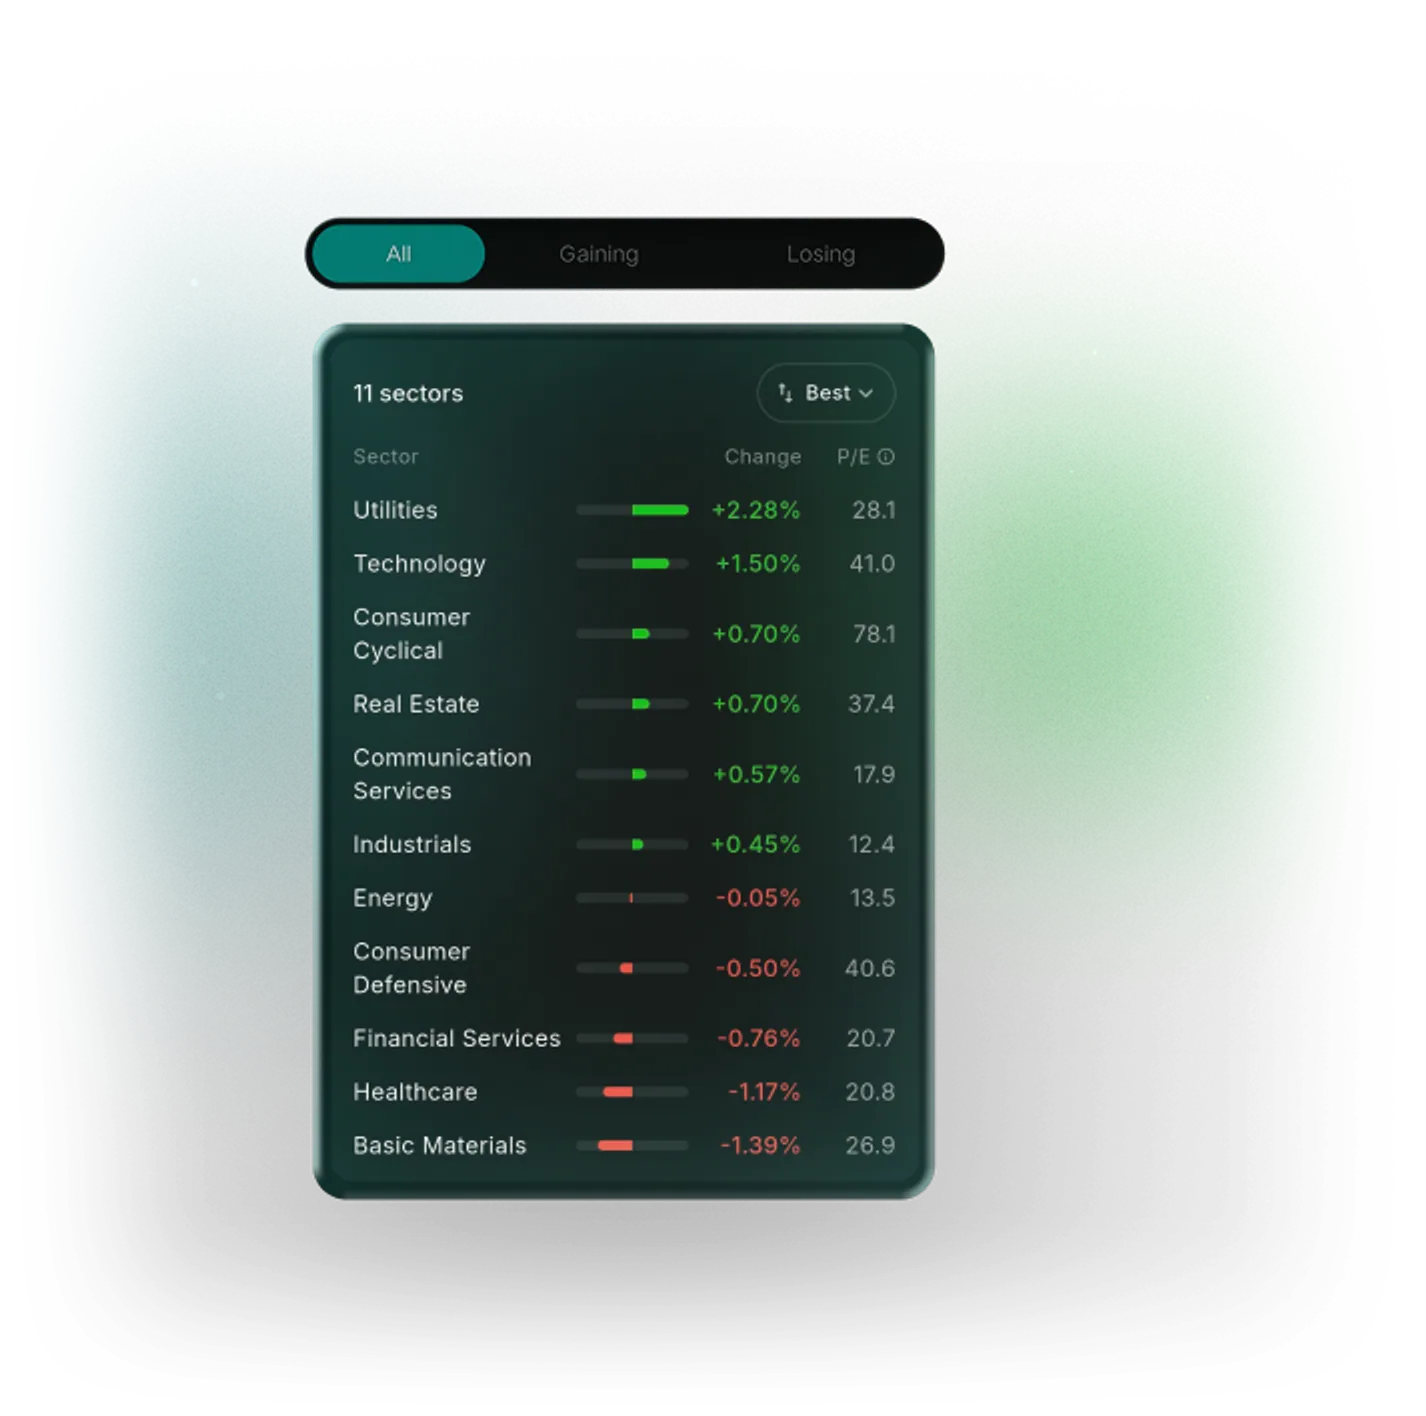
11 sectors in one list
Each sector's average price change and average P/E. The figures describe a past session, not a forecast.
Gaining or losing
Tabs show the sectors that rose, the sectors that fell, or the full list.
Sorted four ways
By largest gain, largest drop, name from A to Z, or highest P/E.
Earlier trading days
"Show sectors on" opens 1 week ago, 1 month ago or a date you pick, with that trading day's change.
Why Follow the Market Sector by Sector
Most market news covers an index and the one or two sectors that led it.
Without a sector view
- Daily headlines name the sectors that led or lagged and leave out the rest
- An index move doesn't show how many sectors rose with it
- Last week's or last month's sector moves take an archive search
- A sector's price move appears without valuation context
With WealthNX
- 11 sectors in one list, each with its average price change
- Market breadth counts the sectors that rose and fell
- "Show sectors on" opens an earlier trading day in the same screen
- Each sector's average P/E sits next to its change
Who Uses Sector Performance?
Investors check sector moves for different reasons.
Self-directed researchers
A sector that moved sharply can be a place to start research. The stock screener filters stocks by sector.
Holders of individual stocks
How the sector of a company you own moved on the same day. Its peers and analyst ratings are in stock analysis.
Newer investors
11 named sectors, from Energy to Healthcare, give a simple way to learn how the market is grouped.
Investors who follow the market day to day
Market breadth shows whether a move was broad or held in a few sectors. Upcoming company reports are in the earnings calendar.
Ask Wealth Genie About Sector Moves
The Stock Assistant explains which sectors moved most and what a sector's average change and P/E mean, in plain words. It describes a past session, not what to buy or sell.
- Which sectors are up today?
- Which sectors moved the most on the latest trading day?
- What does a sector's average change tell me?
- What is the difference between Consumer Cyclical and Consumer Defensive?

Ask Wealth Genie about sector moves on the Plus plan or during the 7-day free trial.
Try Wealth GenieQuestions About Stock Market Sectors
Where can I see sector performance today?
In WealthNX, under Market > Stocks, on the Sector Performance card. It shows the latest trading day: how many of the 11 sectors rose and fell, and each sector's change. FMP data may be delayed or incomplete.
How is a sector's change calculated?
It is the average price change of US-listed companies in that sector on the trading day. An average can hide large moves in individual stocks, so one company can move far more than its sector.
What is market breadth?
Market breadth compares how much of the market rose with how much fell. In WealthNX, it counts how many of the 11 sectors rose and how many fell on the selected day.
What does a sector P/E ratio show?
A sector P/E ratio is the average price-to-earnings ratio of the companies in that sector. It is one measure of how a sector is priced against its earnings, not a sign that a sector is a good investment.
Can I see sector performance for past days?
Yes. "Show sectors on" opens 1 week ago, 1 month ago or a date you pick. Each view shows each sector's average price change for that one trading day, not the change over the week or month. "Back to latest" returns to the latest trading day.
11 Sectors, One Trading Day, One Screen
Each sector's average move and P/E for the latest trading day, or a day you pick.
