
Compare Spending Month Over Month and See What Changed
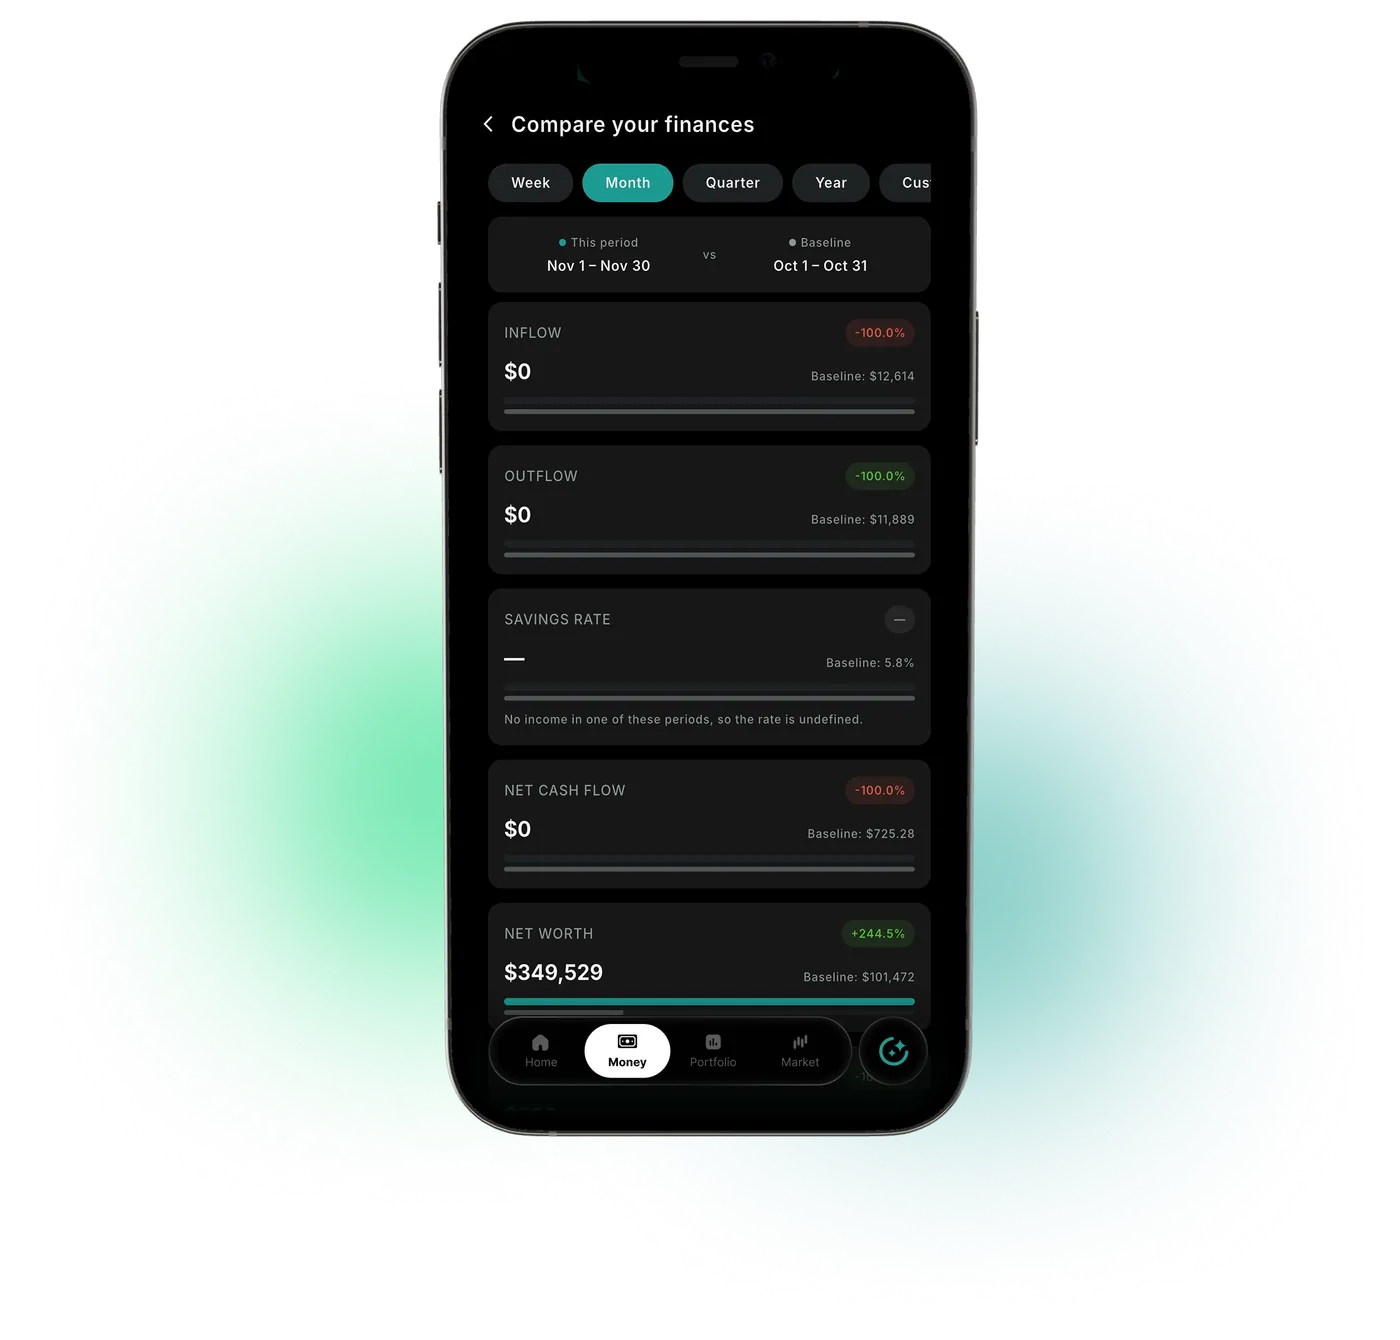
Spending this month vs last month, side by side, from your linked accounts. Any two periods, with the categories behind the difference.
Market data sources




You Spent More This Month and Can't Tell Where
Period Comparison in WealthNX puts any two periods side by side, so you can compare spending month over month and name the difference. Totals and categories line up, and transfers identified between your own accounts stay out of spending totals.
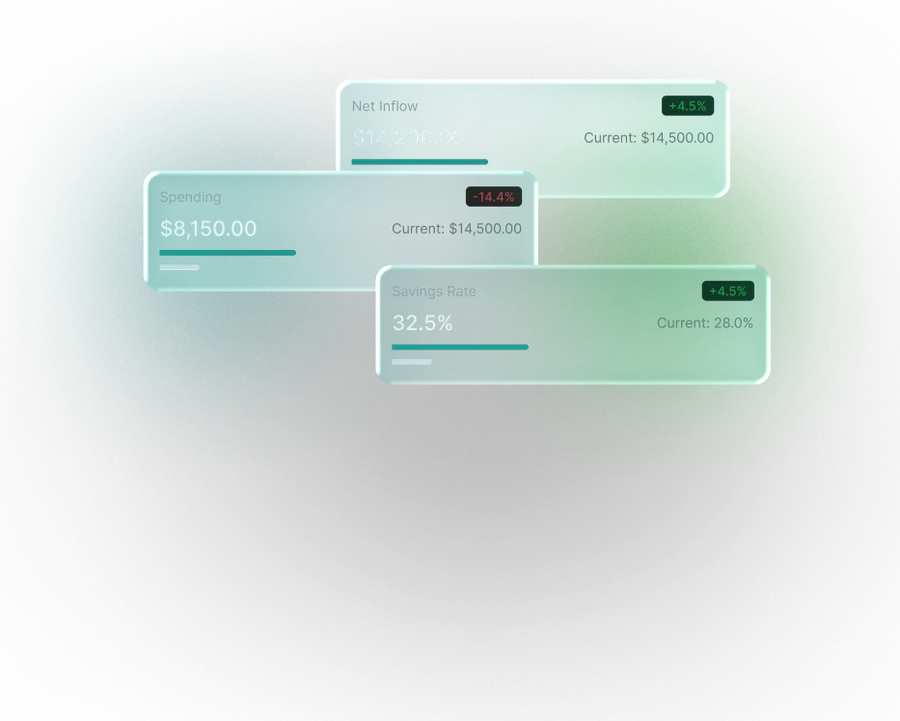
What Period Comparison Shows
Any two periods
This month against last, or two months a year apart.
Side by side
Income, spending and the difference appear next to each other.
Category by category
Each category shows how much it moved between the two periods.
Clearly labelled dates
Every comparison names its dates, so periods are never mixed up.
Transfers left out
Transactions identified as transfers between your own accounts, or as card payments, are left out of spending.
Based on the data available
The comparison reflects the accounts and categories available for each period.
What a Single Month's Total Can't Show
A single month's total says little until there is something to compare it with.
Without a comparison view
- Your banking app shows one month at a time
- Finding what changed means opening each category
- One big purchase makes a month look worse than it was
With WealthNX
- Two periods share one screen
- Every category's change appears in one list
- A different pair of months puts the unusual one in context
Who Is Period Comparison For?
Comparing months answers a different question for each household.
Households watching their spending
A rise in one category shows up next to the month before, with the change in dollars and as a percentage.
Couples
Partners can compare spending from accounts shared with them through household views.
Seasonal planners
This December against last December shows how holiday spending changed.
Ask Wealth Genie About What Changed in Your Spending
Wealth Genie explains the difference between two periods in plain words, using your categorized spending.
- Why did I spend more this month than last?
- How does this March compare with last March?
- Which category dropped the most since spring?
- What changed in my spending after we moved?

Period Comparison FAQs
What does the Period Comparison feature in WealthNX allow me to analyze?
The Period Comparison feature in WealthNX helps you understand how your finances change between different time periods. You can compare financial information, such as income, spending and cash flow, to see where amounts have increased or decreased. This makes it easier to understand changes in your financial activity rather than looking at each period separately. By reviewing these differences, you can better understand your financial position and make more informed decisions about your money.
How does the Period Comparison feature in WealthNX help me identify spending changes?
The Period Comparison feature in WealthNX helps you identify spending changes by comparing your expenses across different time periods. You can review how much you spent during each period and see where your spending has increased or decreased. This gives you a clearer understanding of changes in your expenses and helps you identify areas worth reviewing. By comparing actual spending information, you can make more informed decisions about your budget and financial priorities.
Can I use Period Comparison in WealthNX to evaluate the impact of a budgeting decision?
Yes. The Period Comparison feature in WealthNX can help you review how your spending changes after making a budgeting decision. For example, if you decide to spend less on dining out or subscriptions, you can compare your expenses before and after that decision to see whether your recorded spending decreased. This helps you understand whether your spending is moving in the direction you intended and identify areas that may need further attention. Comparing different periods gives you useful information to support your budgeting decisions.
Can Period Comparison in WealthNX show me income trends over time?
Yes. The Period Comparison feature in Wealthnx can help you review income trends by comparing recorded income across different time periods. You can see whether your income has increased, decreased or remained relatively stable between the selected periods. Reviewing income alongside expenses can also help you understand how changes in either may affect your overall cash flow. These comparisons provide useful context for managing your finances, although the results depend on the completeness and accuracy of your available financial data.
How does WealthNX display the Period Comparison data visually?
WealthNX presents Period Comparison data in a clear, organized view that makes it easy to compare your finances across different time periods. You can review changes in income, spending and cash flow, with color-coded indicators helping you quickly identify increases and decreases. This visual breakdown makes it easier to spot differences, understand changes in your financial activity and identify areas that may need attention, without having to compare figures manually.
Can I compare spending by category between two months using Period Comparison in WealthNX?
Yes. The Period Comparison feature in Wealthnx lets you compare spending across different categories and time periods. You can see which categories have increased or decreased, helping you understand where changes in your overall spending are coming from. For example, you might notice that your total expenses increased mainly because of higher spending on groceries or travel. This breakdown helps you look beyond your total expenses and better understand your spending habits.
Every Month Measured Against the Last
When you know what changed, next month is easier to plan.
